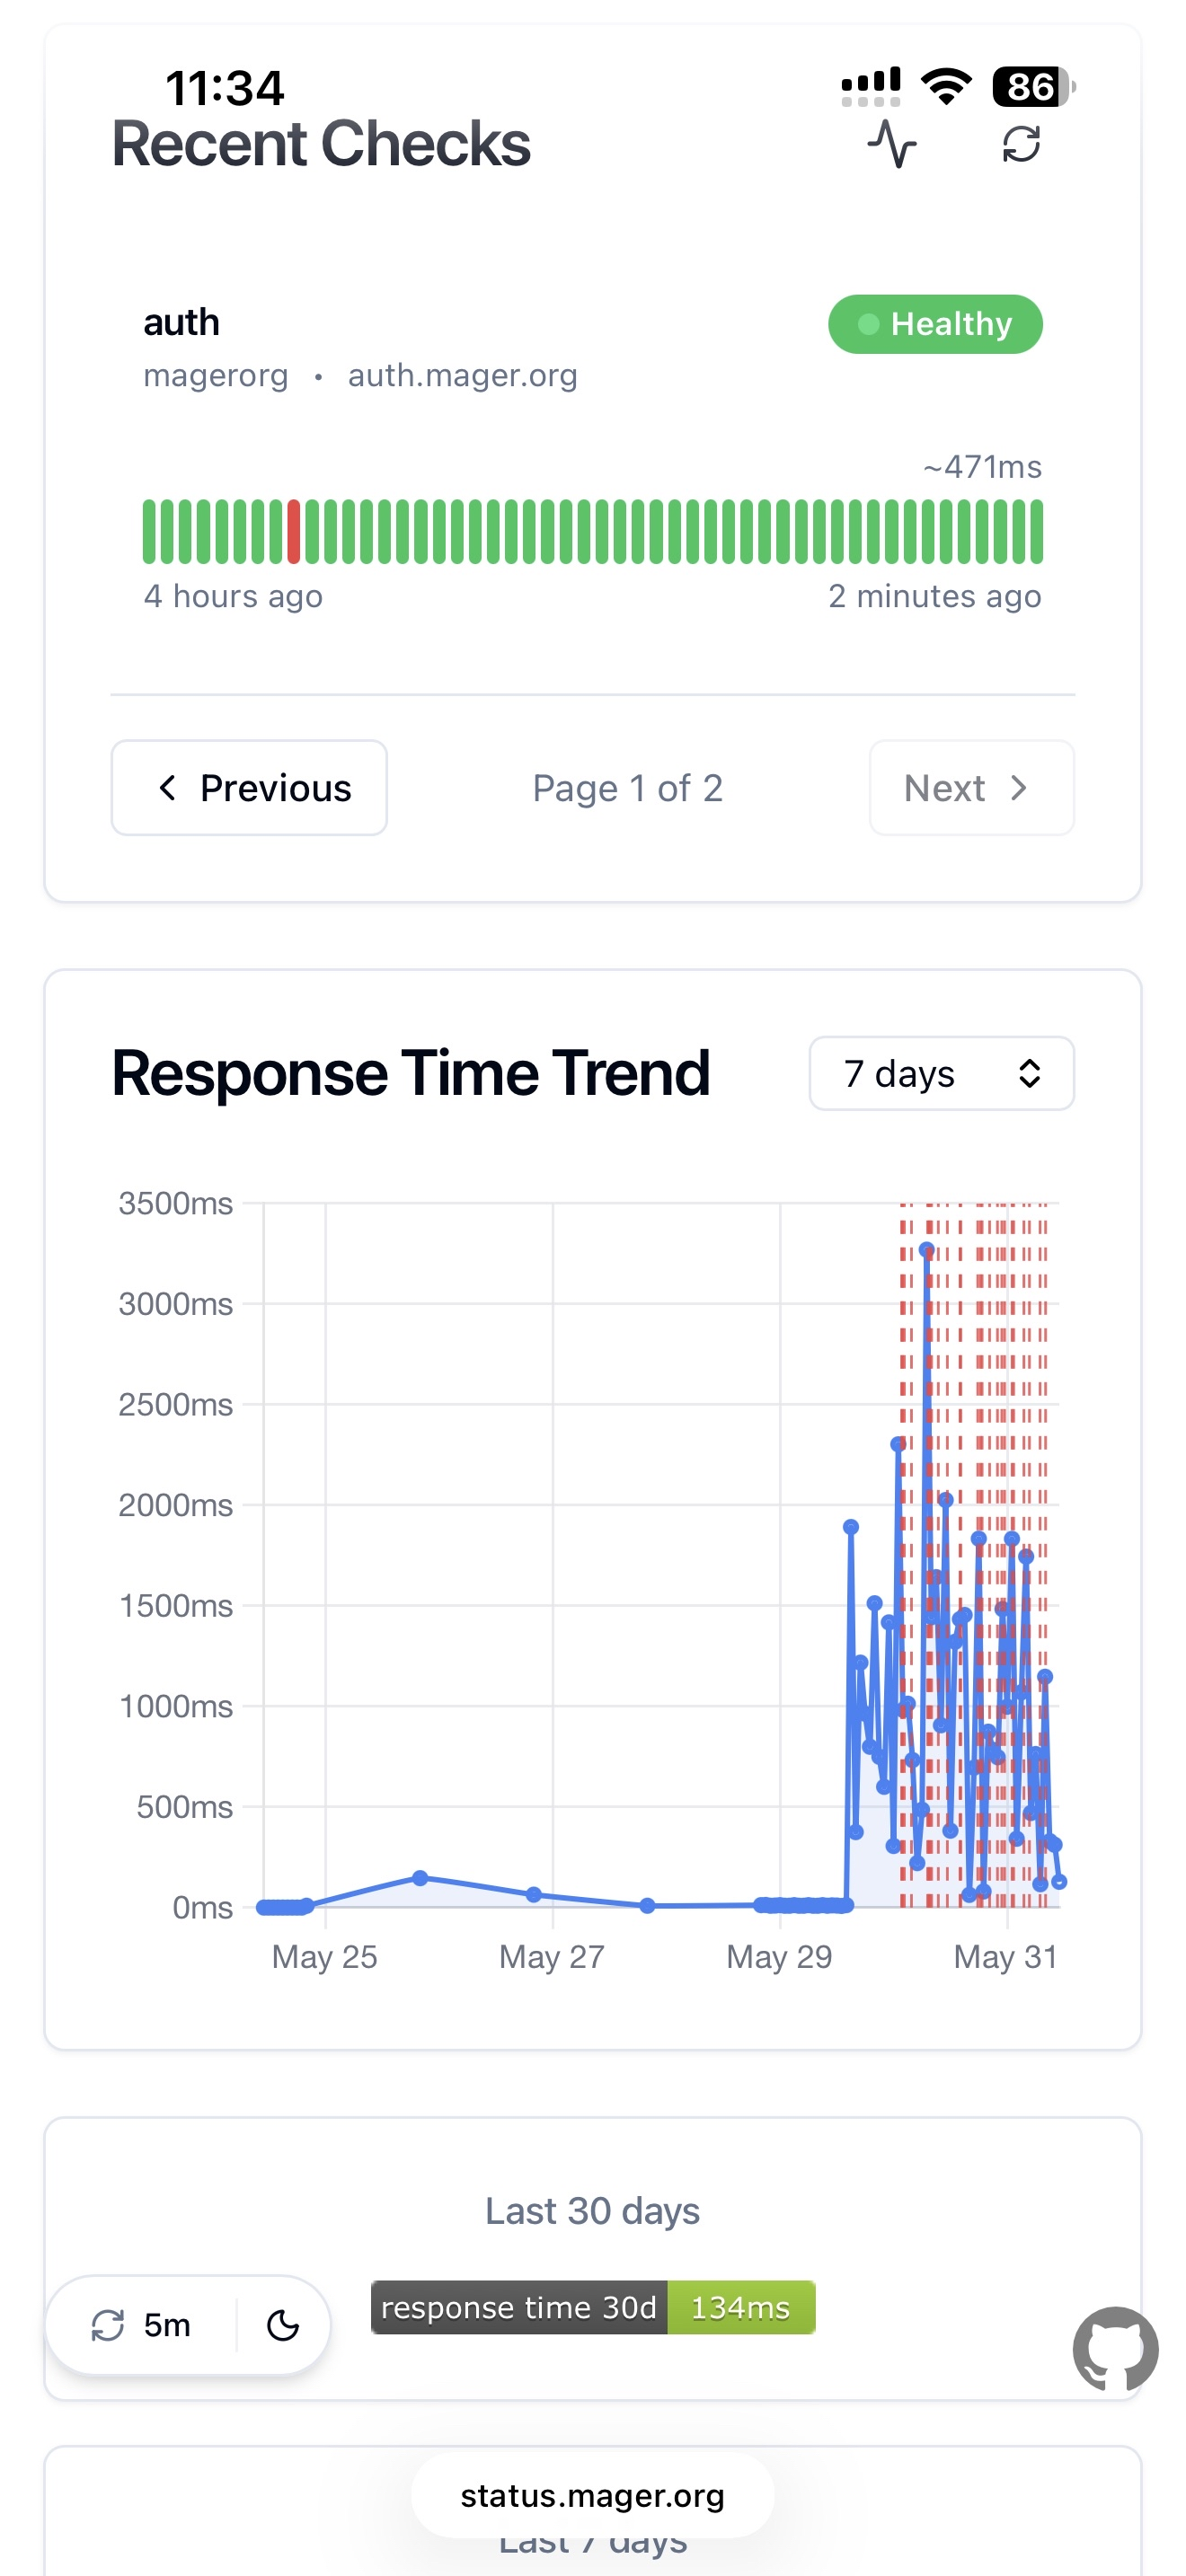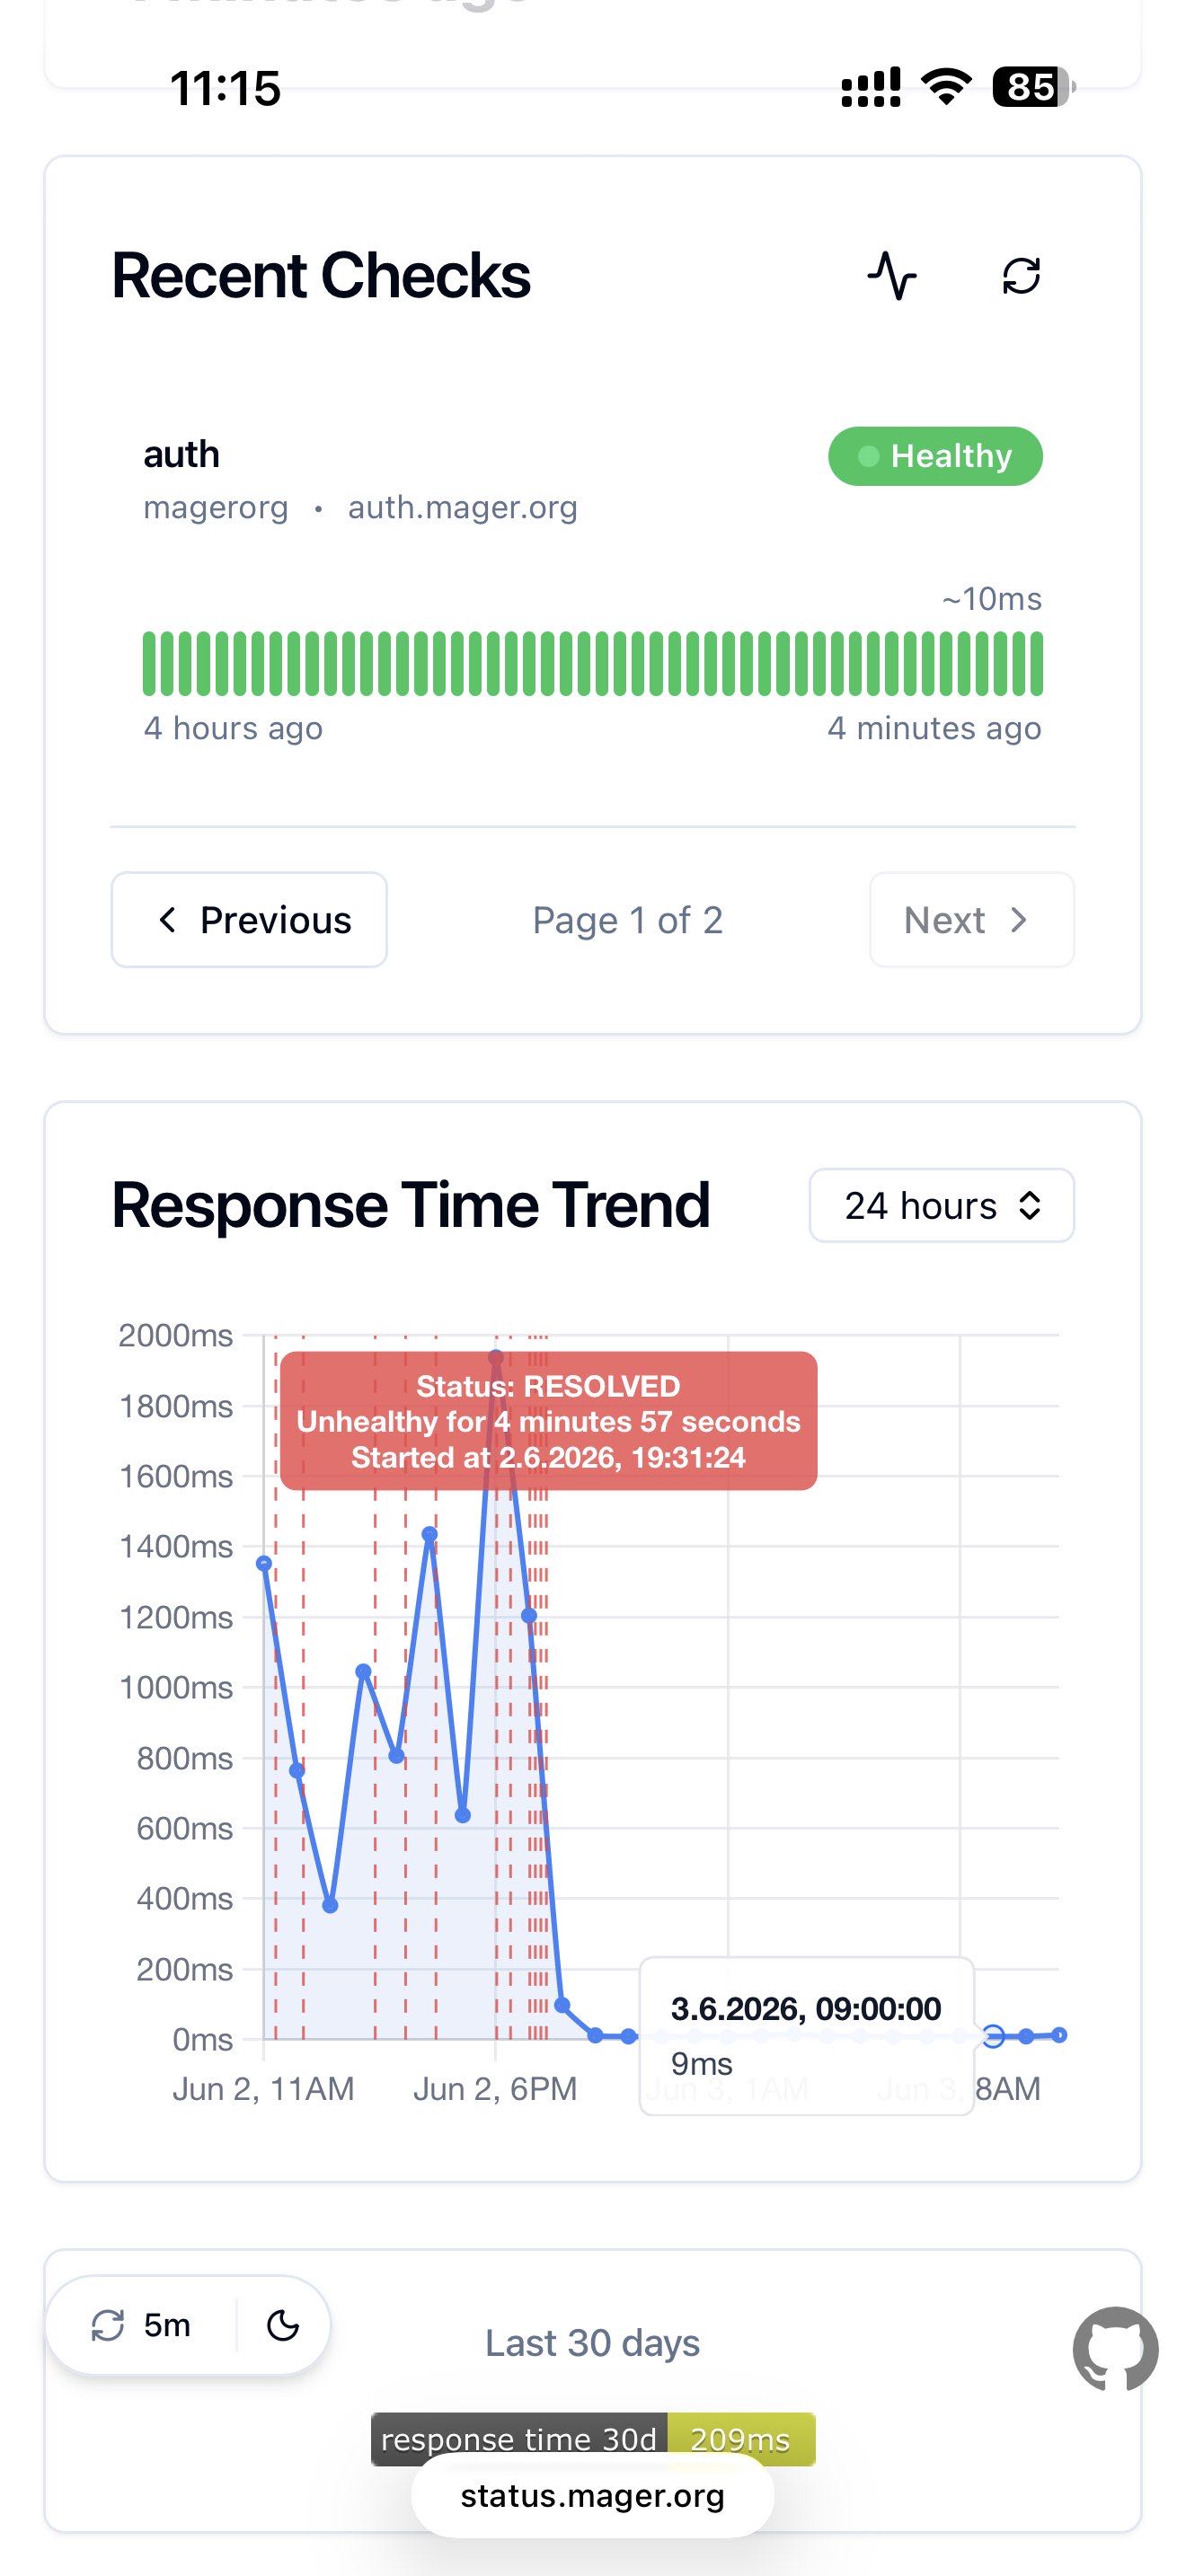

I am seeing that on an otherwise idle server a simple api call to the health endpoint already takes more than 800ms. What is a good way to find out why it takes so long? A typical log entry:
{
"message": "2026/05/30 16:11:22.187 \u001b[1;44m[D]\u001b[0m |2a01:488:66:1000:5c33:9112:0:1|\u001b[97;42m 200 \u001b[0m| 856.493976ms| match|\u001b[97;44m GET \u001b[0m /api/health r:/api/health",
"container": {
"id": "a67a7d99a3ea31303b2081833994b83320168930b061385d13c07eb6eba8270e",
"imageName": "jumager/casdoor:local_deploy",
"created": "2026-05-30T15:41:37.651225711Z",
"imageId": "sha256:fa077721152293705a24194b23dcc4bd293f9cd01bc7538aaef6ac8e6f42a6bf",
"name": "/casdoor"
},
"instance": {
"zone": "europe-west3-a",
"id": "opc5"
}
}
The message above is a bit unreadable, but I could not get rid of the color escapes in the log.